
Power BI is a robust business analytics and visualization tool from Microsoft that helps data professionals bring their data to life and tell more meaningful stores.
This four-week course is a beginner's guide to working with data in Power BI and is perfect for professionals. You'll become confident in working with data, creating data visualizations, and preparing reports and dashboards.
-
About this course
This course will discuss the various methods and best practices that are in line with business and technical requirements for modeling, visualizing, and analyzing data with Power BI. The course will also show how to access and process data from a range of data sources including both relational and non-relational data. This course will also explore how to implement proper security standards and policies across the Power BI spectrum including datasets and groups. The course will also discuss how to manage and deploy reports and dashboards for sharing and content distribution. Finally, this course will show how to build paginated reports within the Power BI service and publish them to a workspace for inclusion within Power BI.
-
Why should you take this course?
✅ Validates your skills
This certification validates your mastery in managing and deploying devices and client applications in an enterprise environment. It also demonstrates your expertise and knowledge.
✅ Enhances Employability
This certification proves your skills and therefore enhances your employability by making you job ready.
✅ Higher growth opportunities
This certification guarantees high growth opportunities. About 23% of Microsoft certified professionals reported receiving up to a 20% salary increase. It also helps you chase further advanced goals in the field of IT.
✅ Provides competitive edge
Microsoft Certifications provide you with a competitive edge over non certified candidates. It is estimated that certified employees earn 15% more than those without certification and are nearly 20% more productive.
✅ Brings recognition
You’ll make immediate impact as a Microsoft Certified Professional. This credential will help you in getting noticed and bring recognition.
-
What will you learn by taking this course?
✅ Ingest, clean, and transform data
✅ Model data for performance and scalability
✅ Design and create reports for data analysis
✅ Apply and perform advanced report analytics
✅ Manage and share report assets
✅ Create paginated reports in Power BI
-
Chapter 1: Prepare the Data
✅ Get data from different data sources
✅ Clean, transform, and load the data
✅ Profile the data
-
Chapter 2: Model the Data
✅ Design a data model
✅ Develop a data model
✅ Create measures by using DAX
✅ Optimize model performance
-
Chapter 3: Visualize the Data
✅ Create reports
✅ Create dashboards
✅ Enrich reports for usability
-
Chapter 4: Analyze the Data
✅ Enhance reports to expose insights ✅ Perform advanced analysis -
Chapter 5: Deploy and Maintain Deliverables
✅ Manage datasets ✅ Create and manage workspaces -
Chapter 6: Prepare the Data
✅ Get data from different data sources
✅ Profile the data
✅ Clean, transform, and load the data
-
Chapter 7: Model the Data
✅ Design a data model
✅ Develop a data model
✅ Create measures by using DAX
✅ Optimize model performance
-
Chapter 8: Visualize the Data
✅ Create reports
✅ Create dashboards
✅ Enrich reports for usability
-
Chapter 9: Analyze the Data
✅ Enhance reports to expose insights ✅ Perform advanced analysis -
Chapter 10: Deploy and Maintain Deliverables
✅ Manage datasets ✅ Create and manage workspaces
-
What is the Microsoft Power BI service?
The Power BI service is a cloud-based business analytics service that enables anyone to visualize and analyze data with greater speed, efficiency, and understanding. It connects users to a broad range of cloud-based and on-premises data through easy-to-use dashboards, interactive reports, and compelling visualizations that bring data to life.
-
What is a Power BI 'business user'?
The way you interact with Power BI will depend on your job role. As an end user or business user, you are the person who receives content (dashboards, reports, and apps) from colleagues. You work in the online or mobile version of Power BI, which is called the Power BI service, reviewing and interacting with this content, to make business decisions.
-
What is Power BI Desktop?
Power BI Desktop is a free application you can install right on your own computer. Power BI Desktop works cohesively with the Power BI service. Data scientists, report designers, admins, and developers work with Power BI Desktop to produce reports and make them available to the Power BI service business users, like you.
-
What are the prerequisites for Power BI training?
Skills Required to Learn Power BI- Have good knowledge of data visualization, graphs and charts.
- Knowledge of data modeling.
- Knowledge of mathematical measures.
- Ability to extract data from the web and other sources.
- Ability to build a dashboard.
- Key Features:
- Created by a Security expert :
- Access period : 12 months
- Course duration : 40+ hours
- Quizzes & revision exams :
- Certificate of completion :
- Support : 24/7 hours
Professional Benefits

Professionals work in a wide array of companies, from startups to global organizations. The average annual salary for a business intelligence developer with Microsoft Power BI skills is $62,500 with a usual range between 53 and 92K.
Microsoft with its proven track record in the field of technology, has come to the forefront with the introduction of its compelling analytics tool, Power BI. This report authoring tool allows enterprises to easily visualize and analyse their enterprise data to transform their operations. Also, the siloing effect and biased reporting structures across enterprises create a situation, where key decision makers are forced to take decisions based on partially correct data.
ELIGIBILITY AND REQUIREMENTS
- Excellent knowledge of relational databases and reporting.
- Some exposure to basic programming constructs (such as looping and branching).
- An awareness of key business priorities such as revenue, profitability, and financial accounting is desirable.
- Familiarity with Microsoft Office applications like Excel.
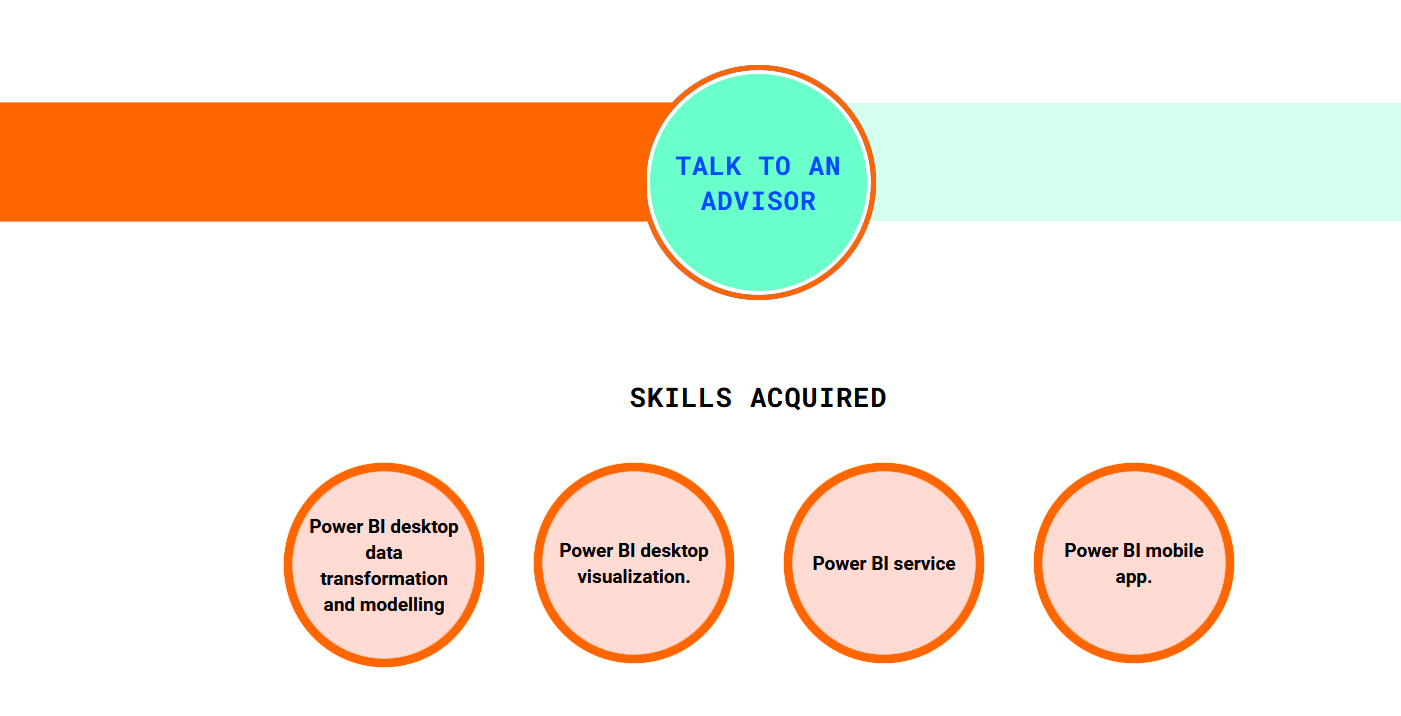
Abilities acquired at course completion

- Performing Power BI desktop data transformation.
- Creating a Power BI desktop visualization.
- Implementing the Power BI service.
- Connecting to Excel data.
- Collaborating with Power BI data.
- Connecting directly to data stores.
- Describing the Power BI developer API.
- Describing the Power BI mobile app.
Boost Engagement with delivering Communication Tools
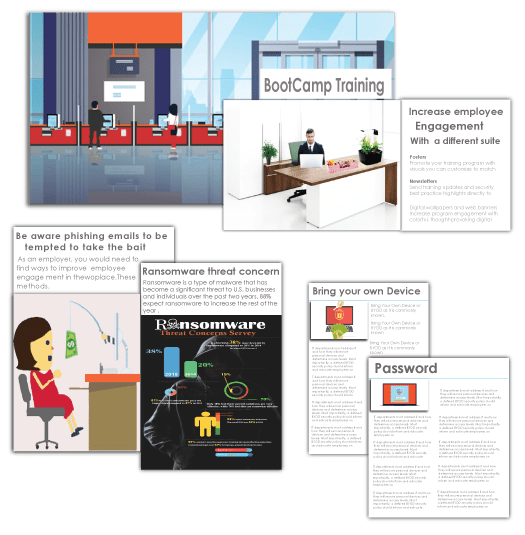
Increase employee engagement with a different suite of communication tools like:
Posters
Promote your training program with visuals you can customize to brand... more
Newsletters
Send training updates and security best practice highlights directly... more
Digital wallpapers and web banners
Increase program engagement with colorful thought-provoking messaging... more
Training Videos/Animations
Strengthen key awareness concepts and skills through stylish visual... more
Why Aspire Tech
Award-winning courses
Aspire's award-winning online courses and programs are created and delivered by a renowned Cyber Security specialist.
The perfect fit for business
Plans for small to large businesses that are flexible to match your budget. There is a volume discount available.
Cost effective training
For a fraction of the expense of traditional classroom training, train thousands of employees in numerous locations.